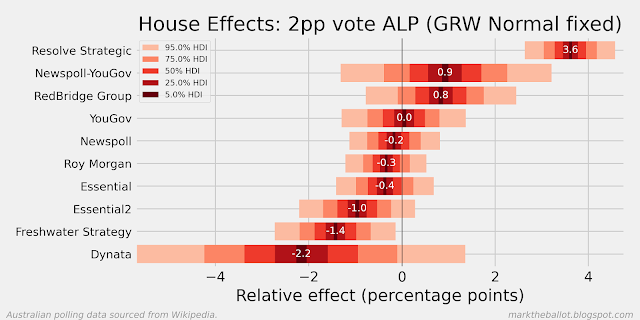
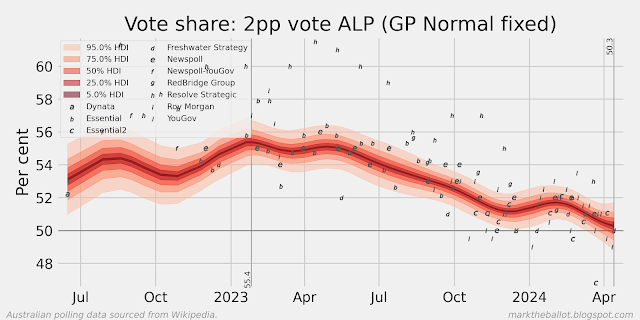
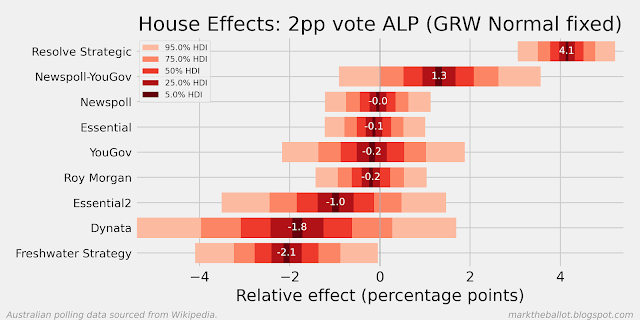
Tuesday, June 18, 2013

Weekly aggregation

While the gender splits in yesterday's Nielsen poll were unfavourable for the government. The splits in the most recent Morgan poll were favourable. According to Morgan:

Analysis by Gender this week shows both genders swinging towards the ALP but with a wide divergence between men and women. Women are now evenly split on a two party preferred basis with the ALP (50%, up 4%) level with the L-NP (50%, down 4%) while men still strongly favour the L-NP (56.5%, down 2%) cf. ALP (43.5%, up 2%).

One of the reasons I aggregate polls is to filter out the noise and reveal the underlying signal. My suspicion is that the most recent movement to the Coalition in Nielsen, and the recent movement to Labor in Morgan are both reflective of the normal variability in polling data. Behind the stochastic perturbations from individual polling houses, I suspect the underlying population voting intention parameter is largely unchanged on last week.

While the poll aggregation (see below) is better news for the Government than a plain-face reading of yesterday's Nielsen poll, it still points to a comprehensive loss at the September election.


Monday, June 17, 2013

Nielsen poll: 43 to 57

Rather than wait until tomorrow for the weekly aggregation, when all of the week's polls are in, I thought I would give a foretaste today, using just Galaxy and Nielsen. I will update the aggregation further tomorrow.

The Nielsen poll particularly caught my eye with its gendered analysis.


I liked what John Stirton had to say in the AFR (pay-walled).  In short, he noted the average of the polls since February has been around 44 to 55 (for the Coalition), and this result is within the margin or error of that average. He also noted that while the hypothetical scenario polls suggest Kevin Rudd might poll better than Julia Gillard, these polls do not take into account the context and consequences of change.

My key Nielsen charts follow.


And on to the aggregation ...


Tuesday, June 4, 2013

Weekly aggregation (44.6 to 55.4)

Three polls this week:

  • Newspoll has moved two points against the government (42-58)
  • Morgan has moved one point against the government (44.5-55.5)
  • Essential is unchanged (45-55)

Let's start with the Newspoll, which was a bit of a shocker for the Government. The Greens also appear to be going through a purple patch.


Without further evidence of a new slump, I suspect the most recent two-point movement from Newspoll was mostly noise. My gut feeling is that the underlying voting intention is not moving much at the moment. At this stage we are not seeing similarly large movements from the other polling houses.


This status-quo LOESS result is confirmed by the Bayesian Aggregation. If you look at the 91-day Henderson moving average, the latest results are not inconsistent with a broader narrative of a slow trickle of votes to the Labor party (call it a slow narrowing).


Friday, May 31, 2013

Predictions at 3.5 months out

In the past week a couple of analysts have turned their hand to forecasting the election outcome.

Julian King at Pottinger has developed a Bayesian model to predict the election outcome based on past election outcomes and the current polls. His conclusion: the Coalition has a 93.6% chance of winning the election, the ALP has a 1.9% chance of winning the election, and there is a 4.5% chance of a hung parliament.

In the Guardian, Simon Jackman (also drawing on Bayesian statistics) observes "I expect some narrowing to be more likely than the Coalition improving on 55-45 TPP. But bottom line: Labor just can’t get to an election winning position from here."

Update


Kevin Bonham has looked at the above analyses. While he agrees with their conclusion, it is not because a five point move in the polls is uncommon. They have happened many times in past; just under different circumstances.

Paul Davis also had a look at these analyses. His assessment is more critical.

Tuesday, May 28, 2013

Weekly aggregation

This week we have two fresh poll reports. A status quo report from Essential (45-55), and 0.5 percentage point improvement for the government from Morgan (45.5-54.5). I have ignored the Queensland-only Galaxy poll, which was a shocker for the government (41-59). My model does not include single-state polls of Federal voting intention.

Both the LOESS and the Bayesian Aggregation suggest that over the past two months there has been a slow trickle of votes back to the government worth almost one percentage point (on the BA - don't get me going about the way in which LOESS exaggerates end point trends).


Sunday, May 26, 2013

Sensitivity tests

When writing about the Bayesian hierarchical model for the poll aggregation, I refer to the assumption that population wide voting intention today is much the same as it was yesterday. In my model I actually make a far more precise assumption: the day-to-day change in voting intention is normally distributed with a standard deviation of one percentage point. I chose this standard deviation for two reasons. First, it was the number initially used in Simon Jackman's model. Second, pragmatically, it seemed to work.

This week I received an email from someone doing similar modelling. In looking at their work, it appeared they had chosen a figure of 0.2 percentage points (one fifth of my value). It left me thinking that I need to do some sensitivity testing on one percentage point assumption I used up until now in my model. I decided to test a range of standard deviations between 5 and 0.1 per cent.

Five per cent


Two per cent


One per cent


Half a per cent


0.2 per cent


0.1 per cent


0.3 per cent

It is clear from the above charts that the day-to-day constraint has little if any effect on the model for the values in the range of 2 down to 0.5 per cent. This means that the daily walk in these runs is essentially unconstrained. At 0.2 per cent, it appears to be having significant impact, and 0.1 per cent it is clearly over-smoothed. The obvious thing to do now is to test 0.3 per cent.


Conclusion

While 0.3 percent has a small impact, it does not have enough in terms of smoothing the resultant aggregation (and ignoring the odd outlier rouge poll). In future, I will use 0.25 per cent in my model.