This week I received an email from someone doing similar modelling. In looking at their work, it appeared they had chosen a figure of 0.2 percentage points (one fifth of my value). It left me thinking that I need to do some sensitivity testing on one percentage point assumption I used up until now in my model. I decided to test a range of standard deviations between 5 and 0.1 per cent.
Five per cent


Two per cent
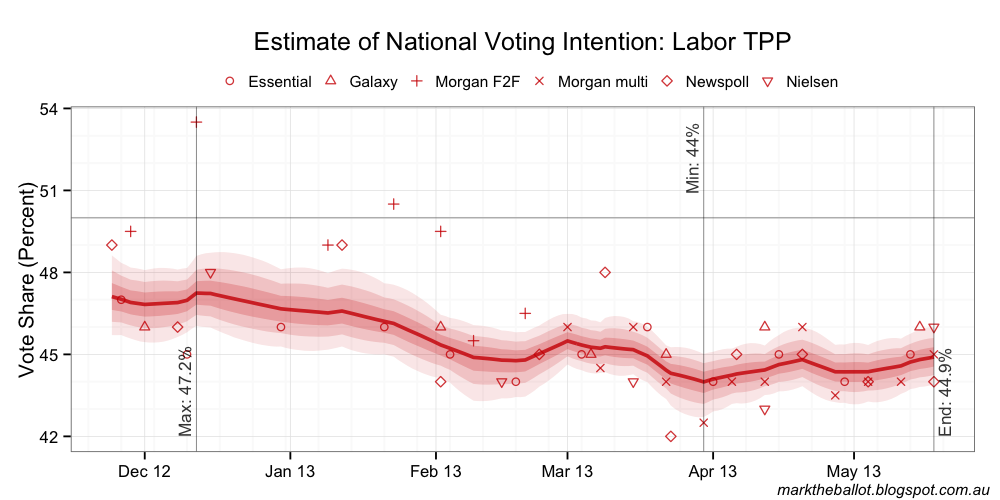


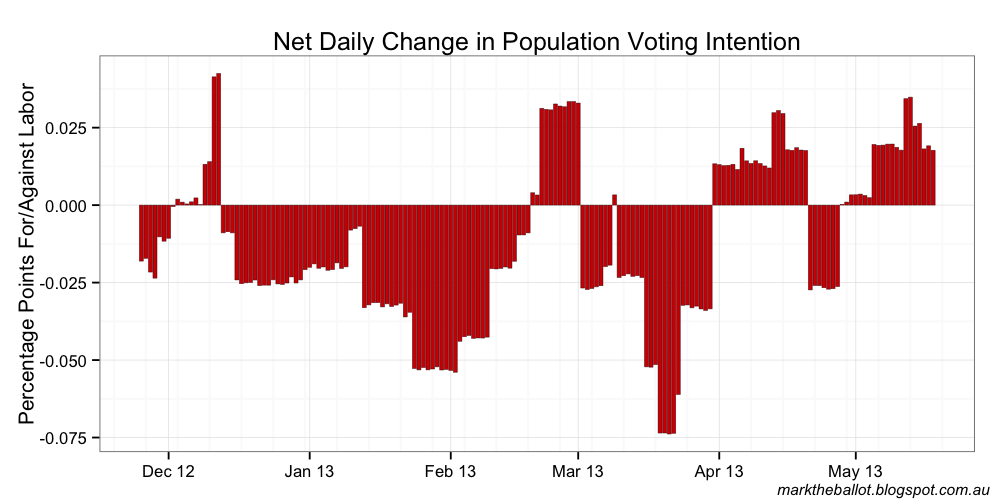
One per cent


Half a per cent


0.2 per cent


0.1 per cent


0.3 per cent
It is clear from the above charts that the day-to-day constraint has little if any effect on the model for the values in the range of 2 down to 0.5 per cent. This means that the daily walk in these runs is essentially unconstrained. At 0.2 per cent, it appears to be having significant impact, and 0.1 per cent it is clearly over-smoothed. The obvious thing to do now is to test 0.3 per cent.


Conclusion
While 0.3 percent has a small impact, it does not have enough in terms of smoothing the resultant aggregation (and ignoring the odd outlier rouge poll). In future, I will use 0.25 per cent in my model.
No comments:
Post a Comment